Sand Analysis Report
Reliable sand monitoring requires more than detection, it requires interpretation over time. ClampOn Sand Analysis Reports transform raw sand monitoring data into clear, structured, and actionable insights, including quantified sand production totals based on historical analysis.
Each report is prepared by experienced ClampOn engineers and tailored to the specific well, system, and operating conditions.
Sand Analysis Reports are based on detailed analysis of historical sand monitoring data collected over the reporting period. ClampOn engineers review trends, events, and long‑term behavior to provide context and understanding beyond instantaneous measurements.
The analysis focuses on:
- Sand production behavior over time
- Identification of trends, patterns, and deviations
- Separation of real sand production from background noise and operational effects
This historical perspective supports more confident operational and integrity decisions.
Where sufficient data is available, ClampOn provides quantified sand production totals, including cumulative sand estimates over the reporting period.
Quantification is based on:
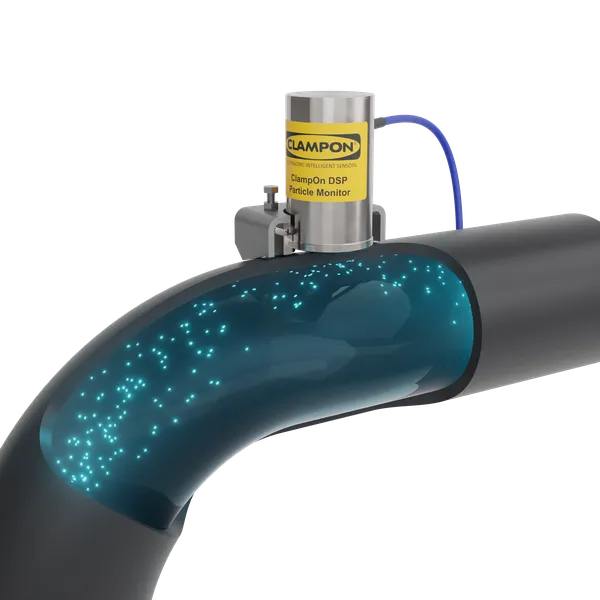
- ClampOn acoustic sand detector data
- Flow velocity at the measurement location
Using these inputs, ClampOn engineers calculate:
- Sand production rates
- Cumulative sand mass over time
- Changes relative to previous periods or baseline behavior
These results support erosion risk assessment, equipment protection, and production optimization.
Accurate sand quantification requires reliable flow velocity input. Flow velocity can be provided directly by the operator or derived from available process data.
Typical inputs used to derive flow velocity include:
- Flow rates
- Pressure and temperature
- Pipe diameter
ClampOn engineers verify the suitability and consistency of the provided process data to ensure that derived flow velocity is representative of actual conditions at the sensor location.
Sand Analysis Reports highlight abnormal sand behavior and sudden changes that may indicate increased risk or altered well conditions.
This includes identification of:
- Increases or spikes in sand production
- Events linked to operational changes such as choke adjustments, startups, or shut‑ins
- Deviations from historical or expected behavior
By clearly identifying abnormal events, the report supports timely mitigation and informed response.
Sand production rarely occurs in isolation. ClampOn engineers correlate sand monitoring data with known operational and process events to explain observed behavior.
Correlation may include:
- Choke and flow changes
- Well interventions or startups
- Changes in flow regime, GOR, or water cut
This context helps operators understand why sand behavior changes, not just that it changes.
Each Sand Analysis Report includes clear, practical recommendations based on interpreted and quantified data.
Recommendations may include:
- Operational adjustments to reduce sand production risk
- Optimization of monitoring or alarm settings
- Follow‑up actions such as Software calibration or system health checks
All recommendations are aligned with operational priorities and risk tolerance.
When delivered on a recurring basis, Sand Analysis Reports enable consistent tracking of sand production and cumulative totals over time. Dedicated ClampOn engineers can follow the same wells across reporting periods, building continuity and deeper system understanding.
This supports:
- Early detection of gradual changes
- Improved confidence in cumulative sand estimates
- More proactive sand management strategies
Sand Analysis Reports can be delivered as a standalone service or as part of broader offerings such as Managed Sand Monitoring or the Sand Management Program.
Whether used for periodic review or continuous oversight, the reports provide a structured, quantitative basis for sand‑related decision‑making.